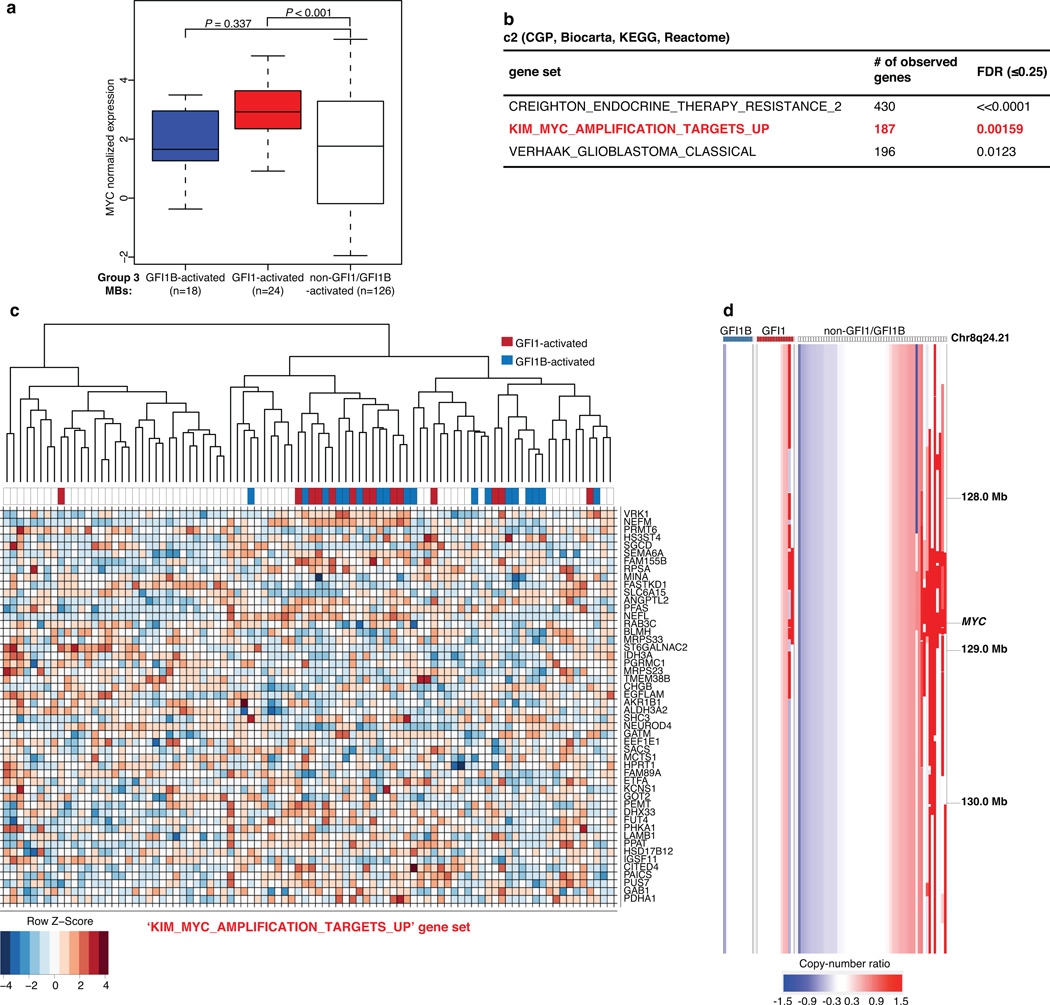
Extended Data Figure 8. Association between GFI1/GFI1B activation and MYC in Group 3 MB.
(a) MYC expression in Group 3 MBs (n=168) according to GFI1/GFI1B activation status. (b) Genesets with significant enrichment in GFI1/GFI1B associated genes from the MSigDB c2 gene set collection. The collection highlighted in red is the only result found that shows a significant enrichment in both GFI1 and GFI1B associated genes and a clear connection to a known pathway. (c) Heatmap of the expression values for the 50 genes in the KIM_MYC_AMPLIFICATION_TARGETS_UP gene set with the most significant association with GFI1 or GFI1B expression (the complete gene set contains 187 profiled genes). Genes are ordered top to bottom from most to least significant. A set of 90 Group 3 MBs included in the analysis are displayed. Sample-wise hierarchical clustering was performed only to enhance the visual organization of the heatmap. (d) Affymetrix SNP6 copy-number output for 82 primary Group 3 MBs from the published MAGIC series, highlighting the incidence of MYC amplification in the context of GFI1/GFI1B-activation. MYC amplification was found at a comparable frequency in both GFI1-activated (n=2/14, 14.3%) and non-GFI1/GFI1B-activated (n=10/57, 17.5%) Group 3 MBs. Indicated coordinates are based on the hg18 (NCBI Build 36.1) reference genome that was used in the original MAGIC study.

