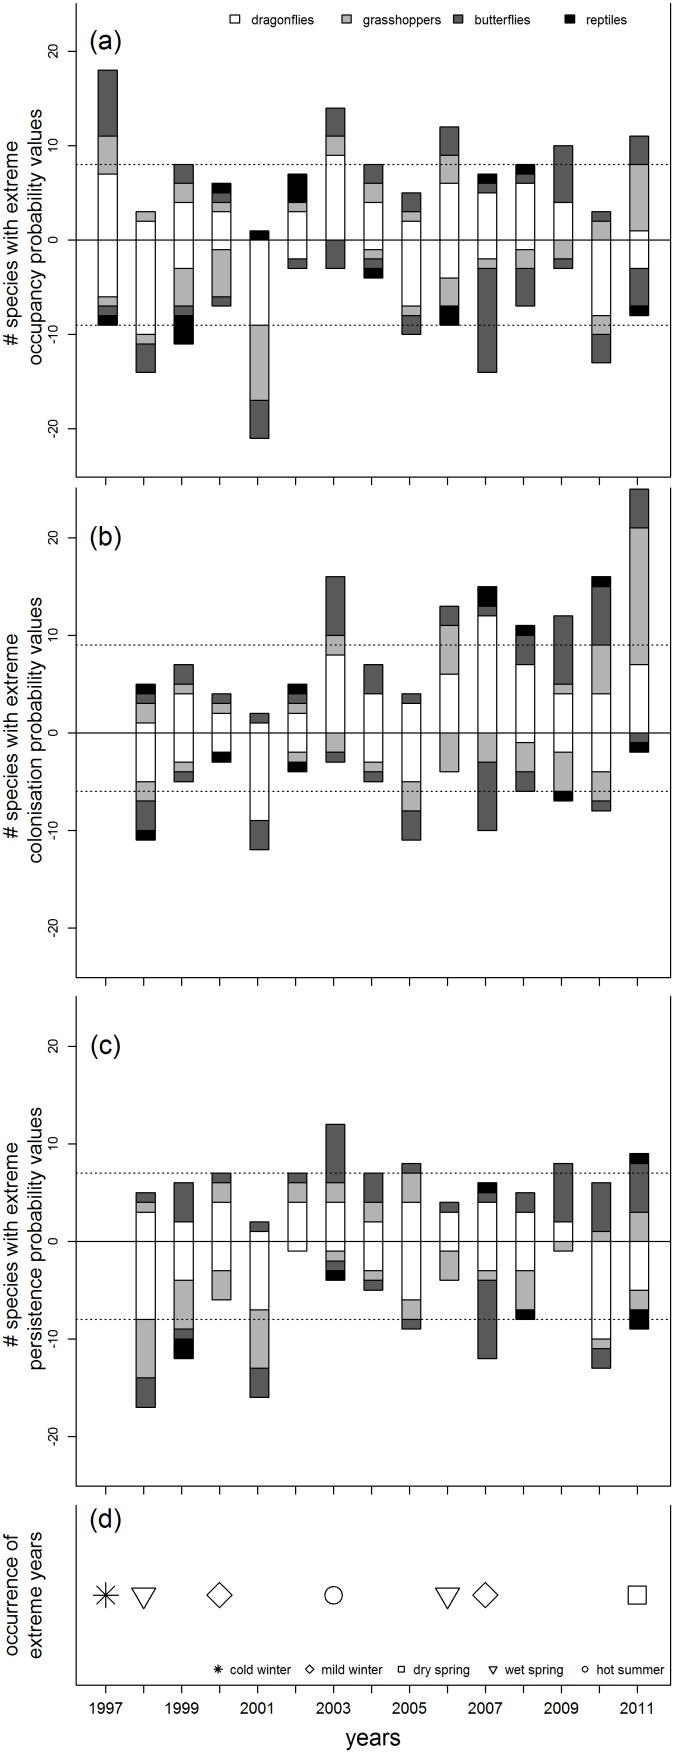
Figure 3. Number of species per year that show extreme values of metapopulation metrics (de-trended).
Positive frequencies refer to years with values greater than mean value +1.5 times standard deviation, negative frequencies refer to years with values smaller than mean value - 1.5 times standard deviation. Dashed line marks the range if the frequencies were distributed uniformly. a) occupancy probability, b) colonisation probability, c) persistence probability, d) occurrence of extreme years. Years with extreme weather are marked as follows:○ hot summer, □ dry spring, ▿ wet spring, ◊ mild winter,  cold winter.

