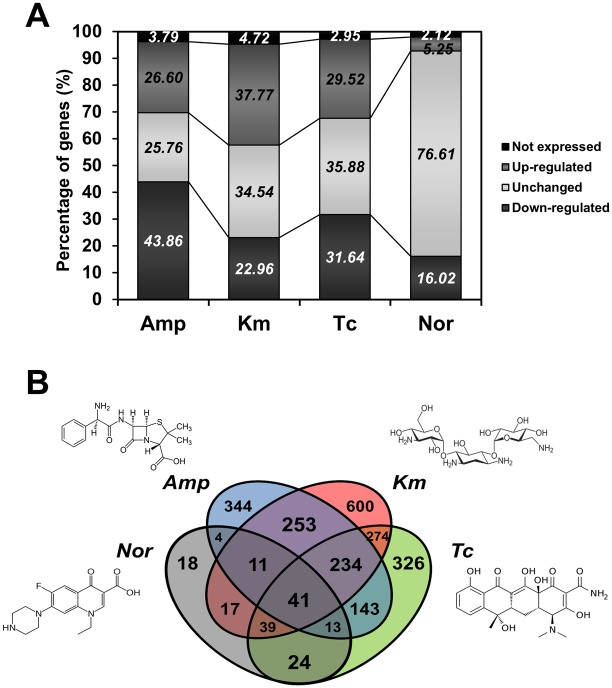
Figure 1. A summary of genes upregulated and downregulated by distinct classes of antibiotics.
(A) The percentages of up- and down-regulated genes under treatment with 4 antibiotics. (B) Venn-diagram showing the number of overlapping genes upregulated by antibiotics of distinct classes. Fold-changes shown are a comparison of the RPKM values of exponentially growing control cells and of cells treated with each antibiotic. Upregulation of gene expression is >1.5-fold change in RPKM value, downregulation is <1.5-fold change.

