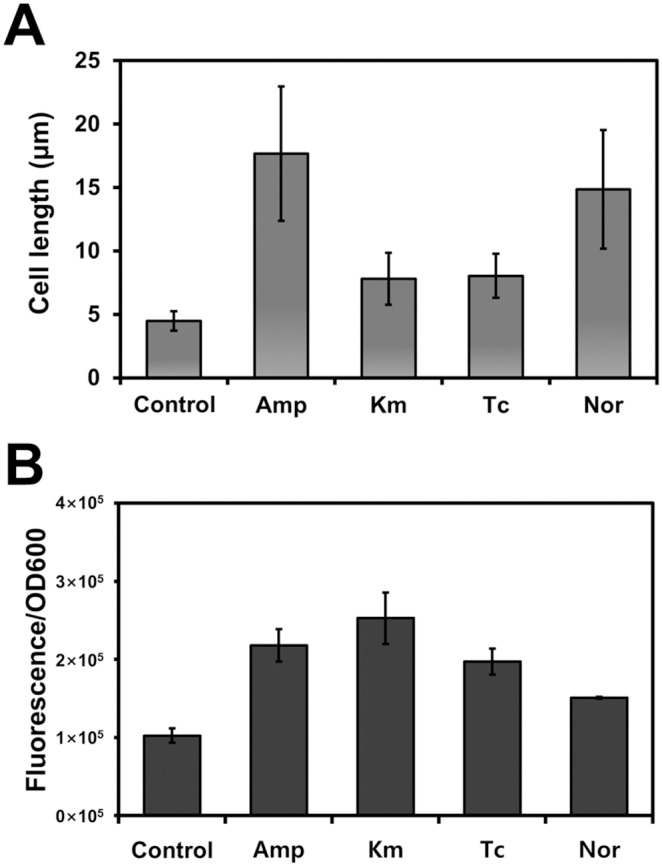
Figure 2. Influence of distinct classes of antibiotics on cell morphology, and membrane permeability in DR1.

(A) The average cell size was measured from 50 cells treated with antibiotics. (B) Membrane permeability was measured using ANS. The error bars indicate standard deviation from triplicate experiments.
