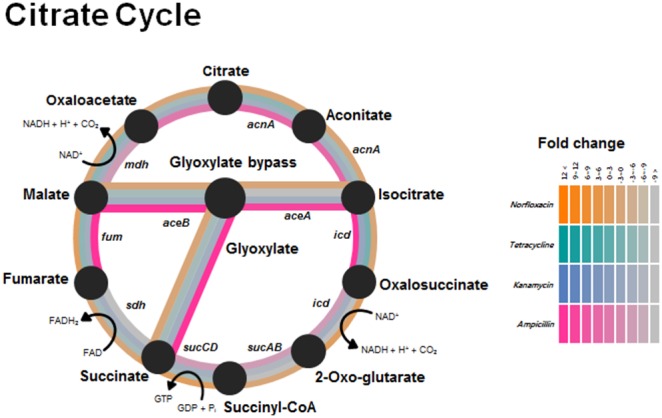
Figure 4. Expression of citrate-cycle genes in A. oleivorans DR1 treated with distinct antibiotics.

Gene-expression changes are represented by a color gradient that is based on the fold-changes of gene expression in response to antibiotic treatments.
