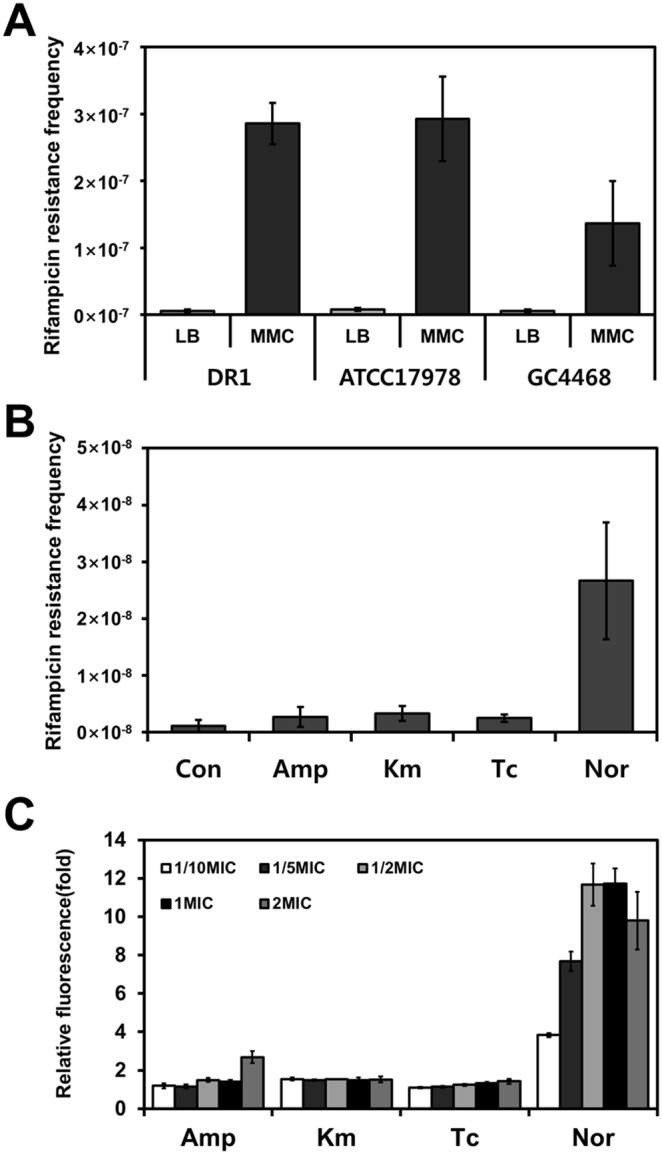
Figure 5. SOS-response induction in Acinetobacter oleivorans DR1.

The mutation frequency, which corresponds to the rifampicin-resistance CFU count divided by the total CFU count, was measured and is represented on the Y-axis in the case of each antibiotic. (A) MMC-induced mutagenesis frequency. (B) Mutagenesis frequency induced by antibiotics of distinct classes. (C) Effect of antibiotics on recA expression was confirmed using a GFP fusion protein.
