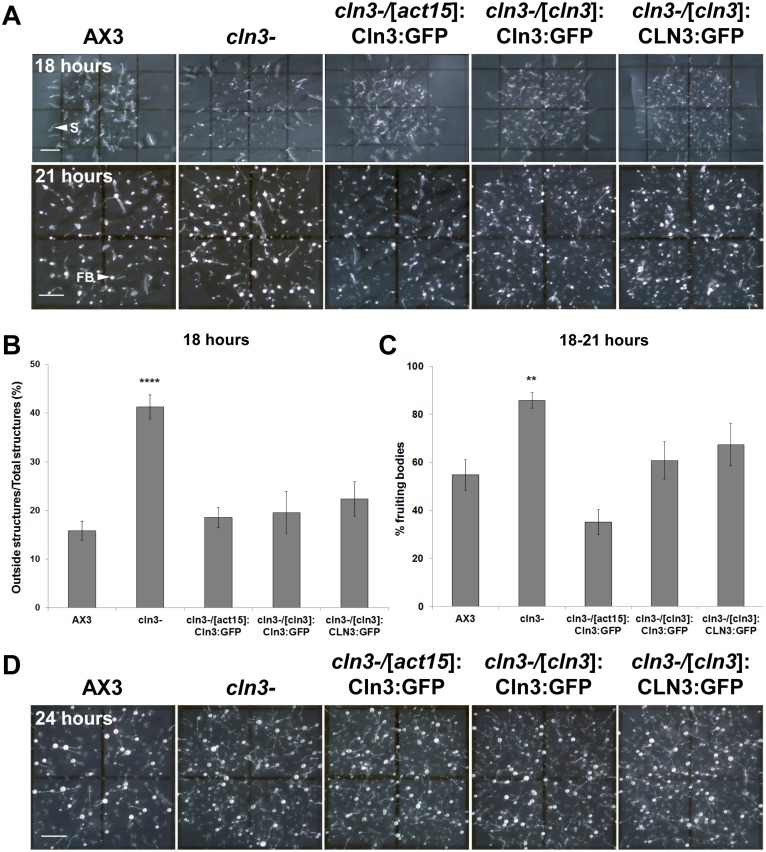
Figure 8. Effect of cln3 knockout on slug migration and fruiting body formation.
(A) AX3, cln3−, or cln3− cells overexpressing GFP-Cln3 or expressing GFP-Cln3 or GFP-CLN3 under control of the cln3 upstream element imaged after 18 and 21 hours of development. (B) Quantification of the number of slugs that migrated outside the spot of deposition after 18 hours. Data presented as mean outside structures/total structures (%) ± s.e.m (n = 10–28). (C) Quantification of the number of fruiting bodies observed after 18–21 hours of development. Data presented as mean % fruiting bodies ± s.e.m (n = 10–32). (D) Fruiting bodies formed after 24 hours of development. Images in A and D are a top-view of developing cells. Statistical significance in B was assessed using one-way ANOVA (p<0.0001) followed by the Bonferroni multiple comparison test (****p-value<0.0001 vs. AX3). Statistical significance in C was assessed using the Kruskal-Wallis test followed by the Dunn multiple comparison test (**p-value<0.01 vs. AX3). Scale bars = 1 mm. S, slug; FB, fruiting body.

