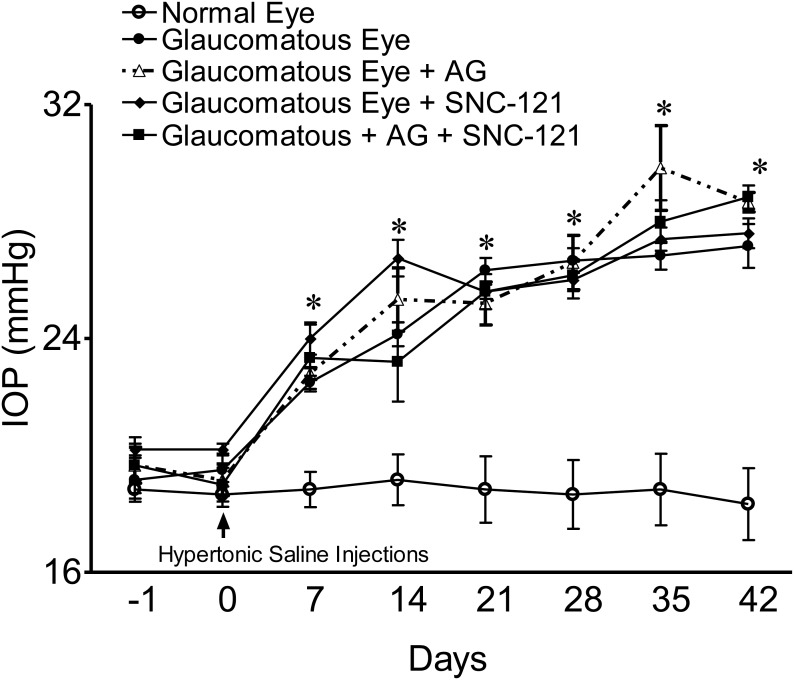
Figure 1. Intraocular pressure (IOP) measurements in normal and glaucomatous eyes.
IOP of normal eyes and eyes from a chronic glaucoma model with and without AG (25 mg/kg; i.p.) and SNC-121 (1 mg/kg) treatment for 7 days (once daily) was measured as described in the Methods. IOP was elevated in one eye of Brown Norway rats by injecting approximately 50 µL of 2.0 M hypertonic saline, while the contralateral eye served as the control. Rats were maintained for up to 6 weeks post-surgery. Data are mean ± SE. *P<0.05; n = 6–8 for each group.

