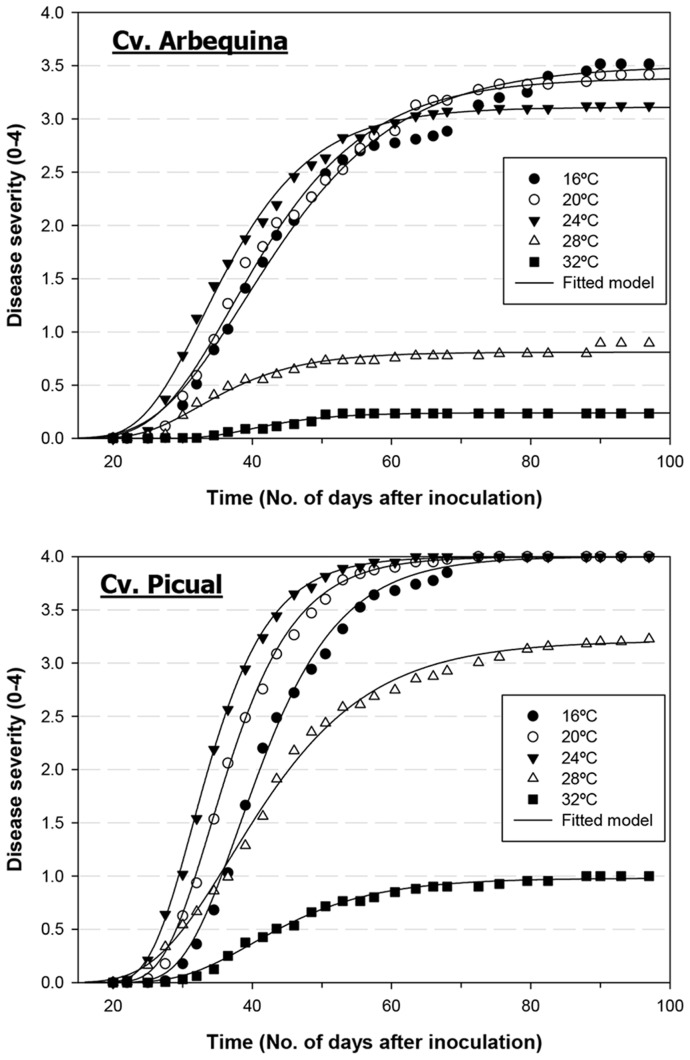
Figure 2. Verticillium wilt disease progress at different soil temperatures.
Verticillium wilt disease progression in olive cvs. Arbequina and Picual grown in soil infested with the defoliating pathotype of Verticillium dahliae and incubated at different soil temperatures. Each point represents the mean disease severity (0–4 scale: 0 healthy, 4 = dead plant) of data from two repeated experiments, each comprising 10 pots with one plant per pot, at 2-to-3-day intervals. Solid lines represent the predicted disease progress curve calculated with the Gompertz function.

