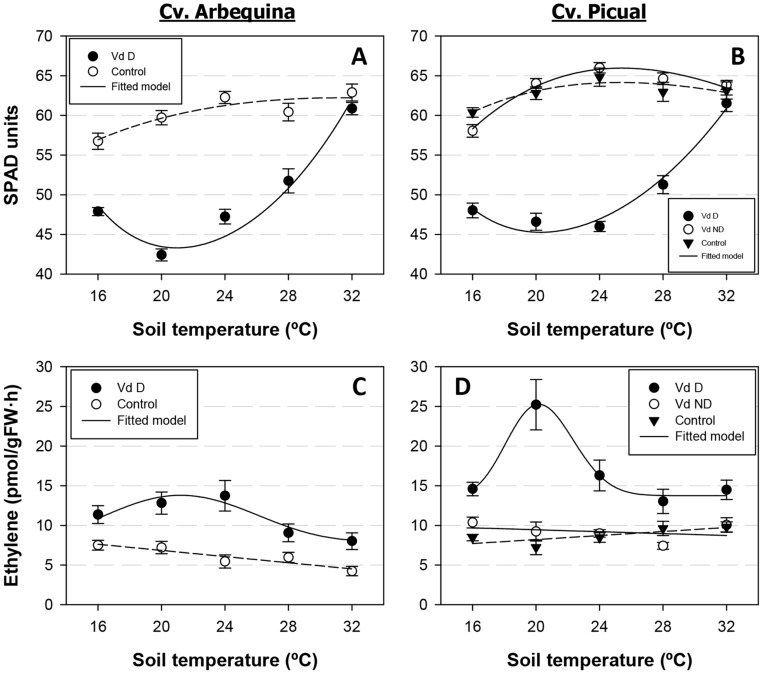
Figure 4. Relationship between stress-related parameters and soil temperature.
Relationship between stress-related parameters and soil temperature in olive cvs. Arbequina (Arb) (left panels) and Picual (Pic) (right panels) grown in sterilized soil (control) or in soil infested with the defoliating (D) or the non-defoliating (ND) pathotype of Verticillium dahliae. A. Chlorophyll content (SPAD readings); B. Ethylene production. Each point represents the mean of data from two repeated experiments, each comprising six pots with one plant per pot, at 2-week intervals. For each parameter, the average daily increase was calculated as the standardized area under the parameter value progress curve over the observation period. Vertical bars represent the standard error of the mean. Lines represent the predicted model calculated with a Type I combined exponential and power exponential function.

