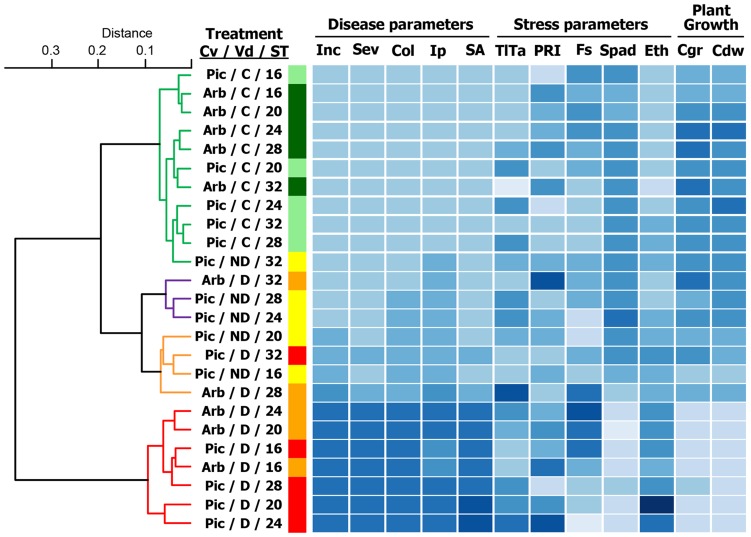
Figure 6. Dendrogram showing results of cluster analyses and heat map representation of disease, stress, and plant growth parameters.
The 12 parameters selected for the heat map representation were related to Verticillium wilt reaction (5 parameters): Final disease incidence (Inc), Overall disease severity (Sev), Standardized area under disease severity progress curve (SA), Time to initial symptoms (Ip), and Intensity of stem vascular colonization (Col); related to stress (five parameters): Leaf temperature minus air temperature (TlTa), Steady-state chlorophyll fluorescence (Fs), Photochemical reflectance index (PRI), Chlorophyll content (Spad), and Ethylene production (Eth); and related to plant growth (two parameters): Relative rate of canopy growth (Cgr) and Dry canopy weight (Cdw). Agglomerative cluster analyses were performed based on the Spearman correlation matrix calculated from values of the different parameters using the Ward method. Cluster groupings of experimental treatment combinations represented in different colors were estimated on the basis of the average silhouette width according to the Mantel statistic. In the heat map, for each column, cells represent the relative value of each parameter for each experimental treatment combination of soil temperature, olive cultivar, and non-inoculated control and Verticillium dahliae pathotypes of the study from two repeated experiments.

