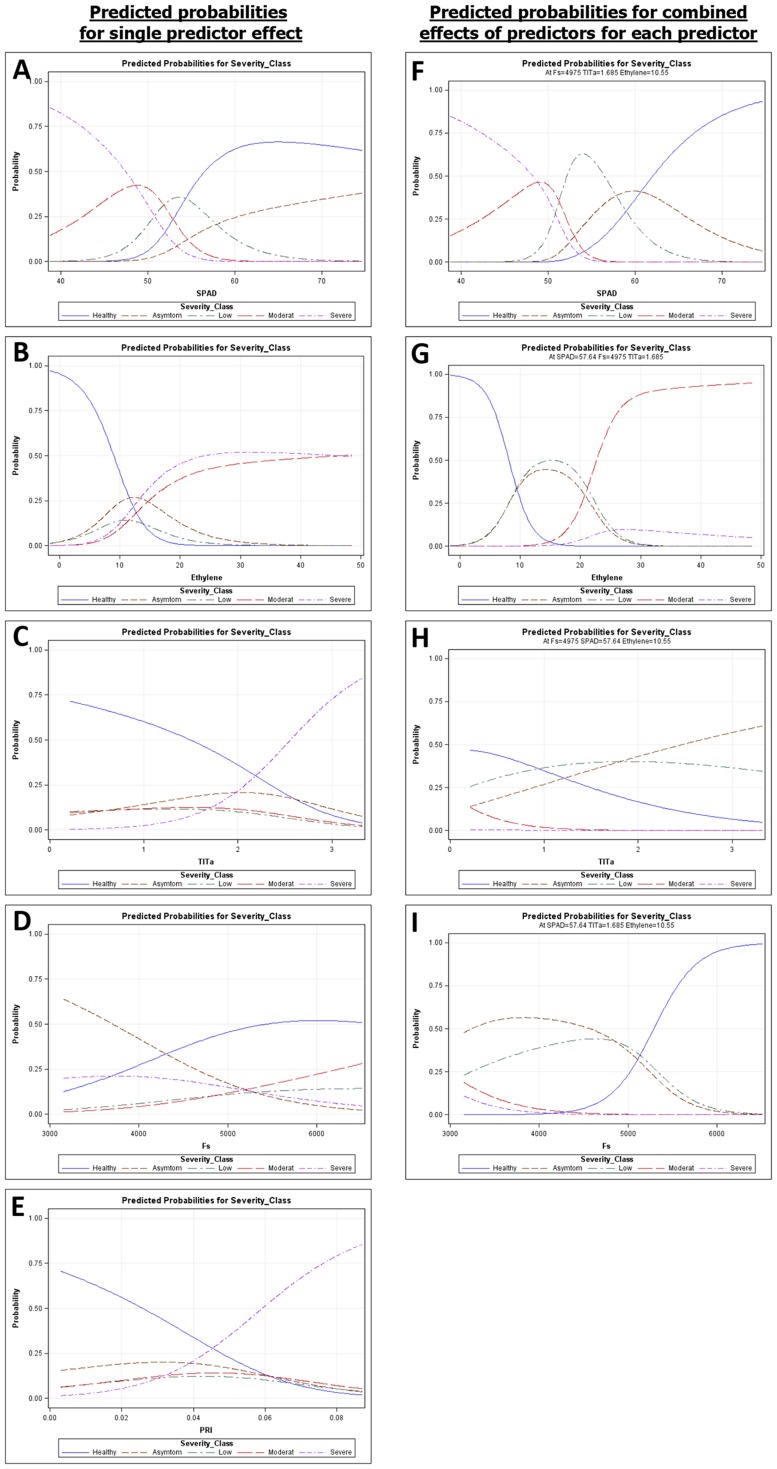
Figure 7. Predicted probabilities according to the multinomial logistic regression model with Verticillium wilt severity as the response variable and stress-related parameters as explanatory variables using healthy plants as the reference category.
Left panels (A to D) represent the predicted probability distribution curves for each stress parameter fitted separately. Right panels (E to I) represent the predicted probability for each of the four stress parameters when the other three are fixed. A, F. Chlorophyll content (SPAD value); B, G. Ethylene production; C, H. Steady-state chlorophyll fluorescence (Fs); D. Photochemical reflectance index (PRI); E, I. Leaf temperature minus air temperature (Tl-Ta). Severity class indicates the severity of Verticillium wilt symptoms from Healthy control plants to Severe symptom development. Data include a training set of 188 plants selected at random from a total set of 235 plants in two repeated experiments comprising all experimental combinations of soil temperature, olive cultivars, and non-inoculated control and Verticillium dahliae pathotypes of the study.

