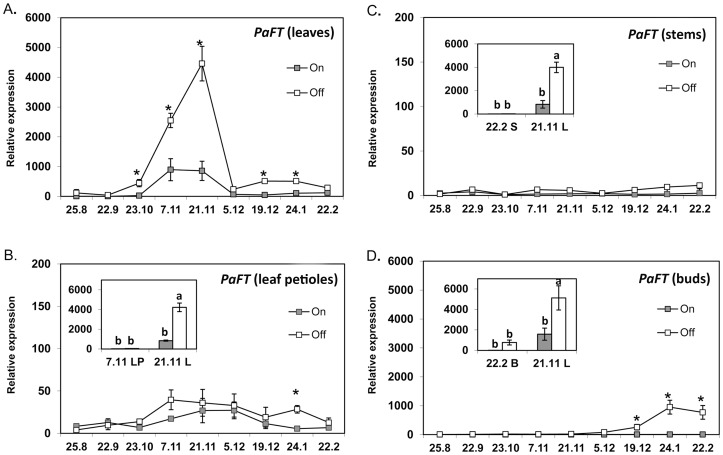
Figure 7. Seasonal expression profiles of PaFT.
Seasonal expression profiles of PaFT in leaves (A), leaf petioles (B), stems (C) and buds (D) from fully loaded (on) and completely de-fruited (off) ‘Hass' trees are presented. Off trees correspond to trees from which fruit load was completely removed in July. Data are means±SE of three independent replicates (n = 3 trees). Stars denote a significant difference between transcript expression in on and off tissues at the same time point (P<0.05). Insets: PaFT expression in leaves (L) vs. leaf petioles (LP), (B) in leaves (L) vs. stems (S), (C) and in leaves (L) vs. buds (B) (D). Different letters indicate statistically significant differences (P<0.05). Sampling dates are presented as dd/m.

