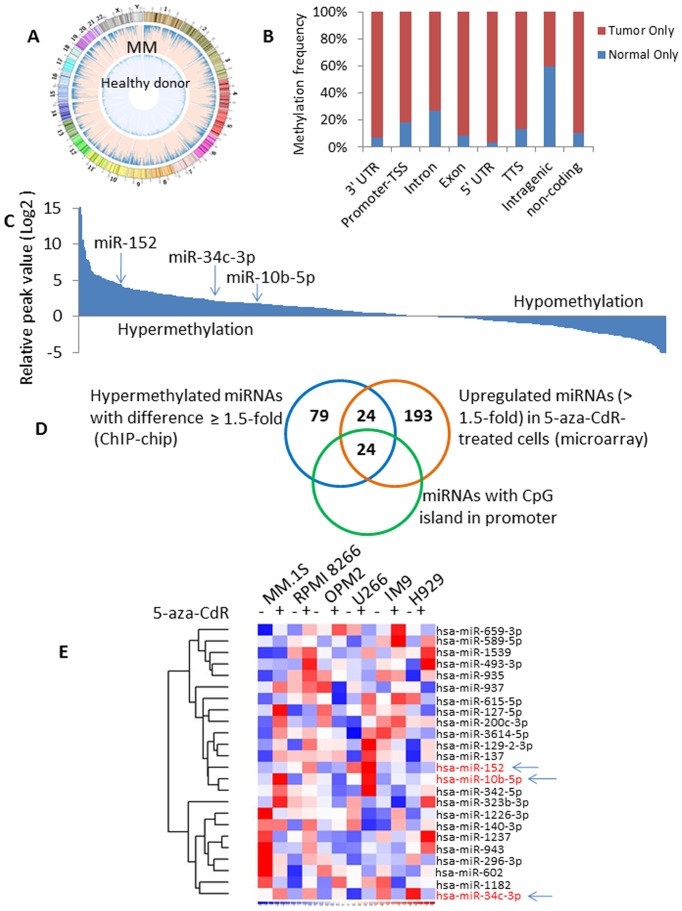
Figure 1. Methylation status of whole-genome sequencing data in MM and healthy donors.
(A) Circular representation of DNA methylation levels in whole genome regions for MM and healthy donors (HD). (B) Genome-wide distribution of methylation peaks by gene regions in HD/MM only. (C) Methylation levels of regions around all known miRNAs in MM patients in decreasing order by peak intensity. Data was presented as log2 values. (D) Venn diagram compared ChIP-chip and miRNA microarray data, as well as miRNAs being present with CpG island. Left, miRNAs identified as high potential methylation with the definition of a difference ≥1.5-fold between MM and HD; Right: miRNAs up-regulated by more than 1.5-fold in at least two cell lines with 5-aza-CdR treatment; Bottom: miRNAs with CpG island. (E) Heatmap of the 24 overlay miRNAs in six MM cell lines with or without 5-aza-CdR treatment. Red, high expression; blue, low expression.

