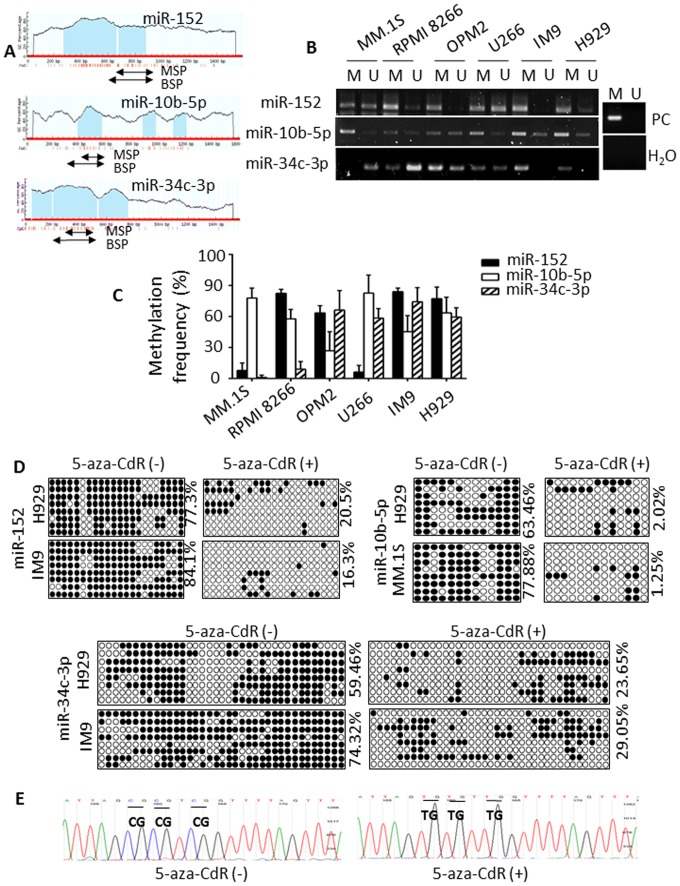
Figure 3. Methylation of miR-152, -10b-5p and miR-34c-3p in MM cells.
(A) Schematic illustration of the percentage of C + G nucleotides (CG%) and the density of CpG olinucleotides were shown for a region spanning 1000 bp upstream and 500 bp downstream of miR-152, miR-10b-5p and miR-34c-3p, respectively. Specific primers for these CpG islands were designed (arrows) and used to amplify these DNA fragments in MM cell lines. The CpG island was depicted, and each vertical bar illustrated a single CpG. (B) Representative MSP results of the three miRNAs methylation inMM1S, RPMI 8266, OPM2, U266, IM9 and H929 cell lines. M: methylated primers; U: unmehtylated primers. PC: positive control. (C) Bisulfite sequencing analysis showed relative methylation frequencies of miR-152, -10b-5p and miR-34c-3p in six MM cell lines. Eight single clones for each sample were selected and T7 primers were used for sequencing. (D) Bisulfite sequencing analysis showed methylation frequencies of miR-152 and miR-34c-3p in H929 and IM9, and miR-10b-5p in H929 and MM1S, treated with or without 5′-aza-CdR (5 µM) for 4 days. Black and white circle represented methylated and unmethylated CpG, respectively. (E) Representative sequencing results showed that the cytosine (C) residues of CpG dinucleotides were converted into thymidine (T).

