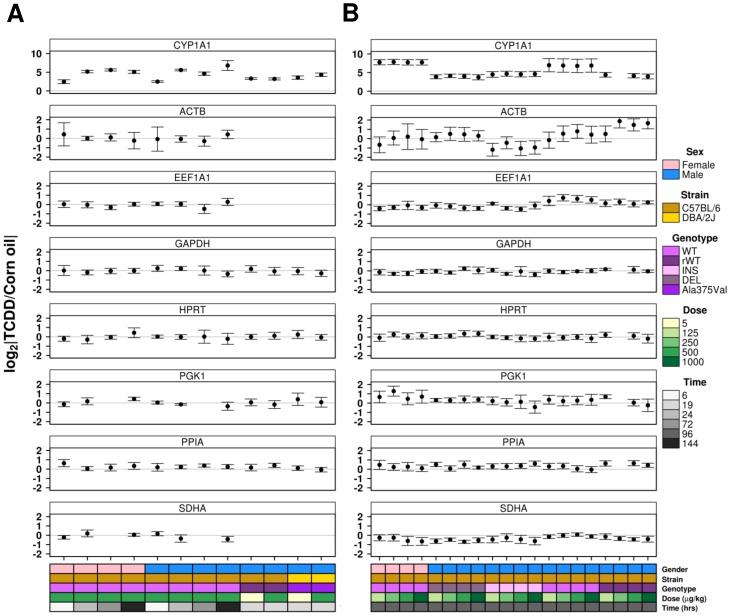
Figure 1. Timecourse and Dose-response by Treatment Group.
The fold-differences in protein abundance between treated and control animals were calculated and results compared across all conditions. (A) Timecourse and (B) dose-response studies were visualized. Points represent the fold change in abundance (in log2 space) and error bars indicate the standard deviation for each experimentally unique group.

