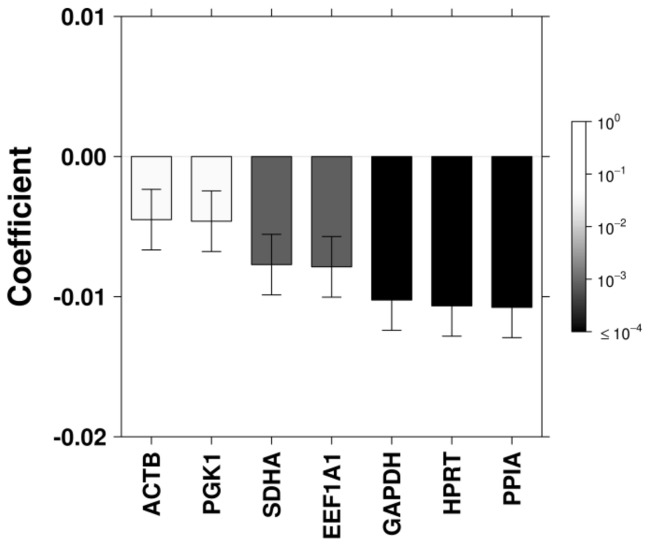
Figure 4. Linear Modelling of Multivariate Results.
Linear modelling was performed to identify the contribution of each candidate to stability as determined by NormFinder across the complete dataset bars are coloured according to FDR-corrected p-value; error bars indicate standard error within the model; negative values are representative of decreased variation (increased stability).

