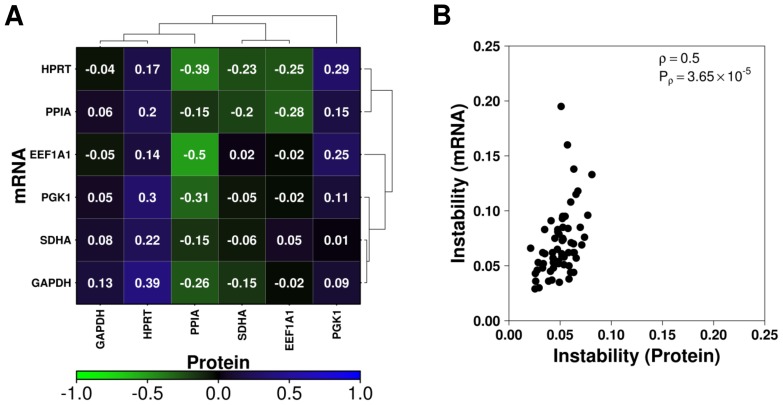
Figure 5. Comparison of candidate mRNA and protein abundances.
mRNA and protein abundances as determined by qPCR and quantitative western blot were compared for each candidate. (A) Spearman's correlation was used to compare mean Cq values across technical replicates for qPCR and protein intensity for candidate genes and visualized in a heatmap organized using divisive clustering: blue indicates perfect correlation, green indicates inverse correlation and black indicates little or no correlation. Note that an increasing mRNA abundance results in a lower Cq; hence an inverse correlation indicates similarity between molecule abundances. (B) Spearman's correlation was used to assess similarity in candidate combination stability calculated by NormFinder for each data type.

