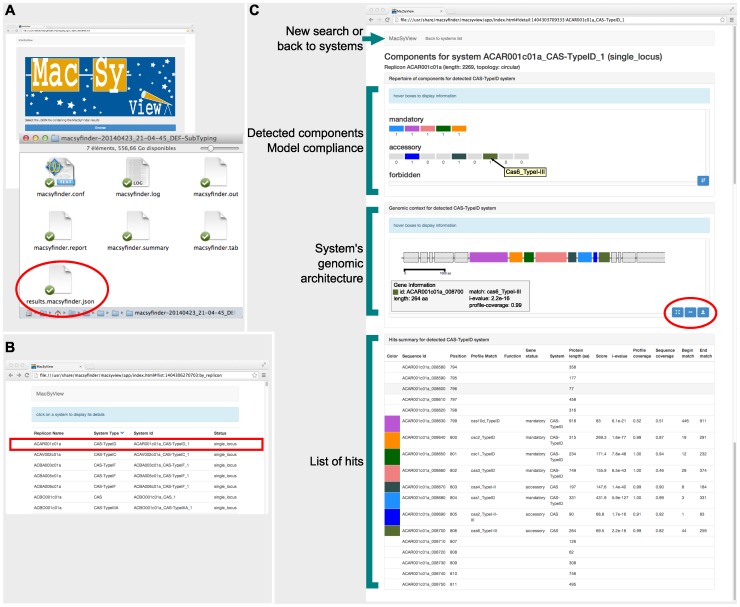
Figure 2. Snapshot of MacSyFinder's results as viewed with MacSyView.
A. The MacSyView web-browser based application allows the visualization of MacSyFinder's output file “results.macsyfinder.json”. B. MacSyView displays the list of systems available in the results file. The user picks a system to visualize by clicking on it in the list. C. The page displaying the system is made of a header, and three panels. The header allows to select another input file, or to go back to the list of systems. It displays information on the system that is being visualized. The first panel shows how the detected system fits the model compliance in terms of its components. Boxes represent the number of each mandatory, accessory, and forbidden components. A tooltip gives the name of the component when the mouse hovers a box. Component boxes can be sorted by decreasing number of components. The second panel shows the genetic context of the system (as transcribed from the input fasta file), with components drawn to scale. When the mouse hovers a box, a tooltip displays information on the corresponding component, including scores of the Hmmer hit. This view can be exported as a SVG file for drawing purposes (tools circled in red). The third panel gives detailed information on the components of the system.

