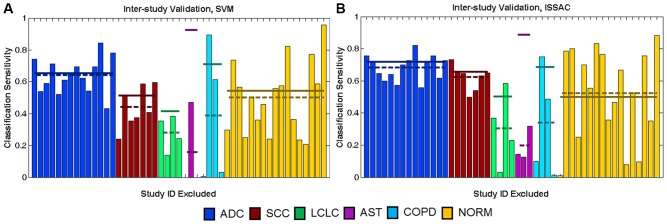
Figure 1. Inter-study validation and randomized cross-validation performance.

The graphs show ISV and RCV results from SVM (A) and ISSAC (B). For clarity, the Study ID labels have been excluded from this visualization (see Text S1 for expanded versions of these plots that include the individual Study ID labels). The colored bars report sensitivities achieved on the validation study designated in the horizontal axis (e.g., the bar on the farthest left in (A) shows that 74% of ADC samples in the first ADC study are correctly classified by SVM when that study is excluded from training). The order of studies in the horizontal axis is identical for panels (A) and (B). Dashed lines represent average ISV sensitivities for each phenotype. Solid lines report corresponding ten-fold RCV sensitivities of each phenotype.
