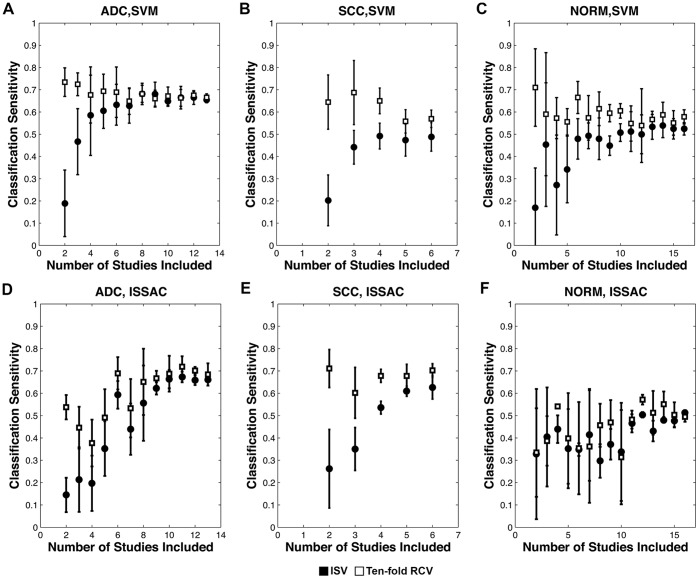
Figure 2. Inter-study-validation and randomized cross-validation results as function of number of studies included in analysis.
Average ISV (black circles) and RCV (white squares) sensitivities as a function of the number of studies included, for ADC (A, D), SCC (B, E), and NORM (C, F), using SVM and ISSAC classifiers.

