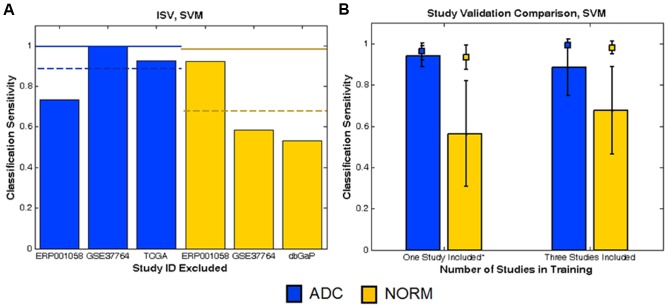
Figure 3. Inter-study validation performance in RNA-seq data based on SVM.
(A) The colored bars report ISV sensitivities achieved by validating performance on the study designated in the horizontal axis. Dashed lines represent average ISV sensitivities for each phenotype. Solid lines report corresponding ten-fold RCV sensitivities of each phenotype. (B) The colored bars report average sensitivities from validating on studies excluded from training. Squares represent corresponding RCV sensitivities from the studies included in the training set. Results were averaged across the different combinations of training studies, and the error bars report the standard deviation of the results.

