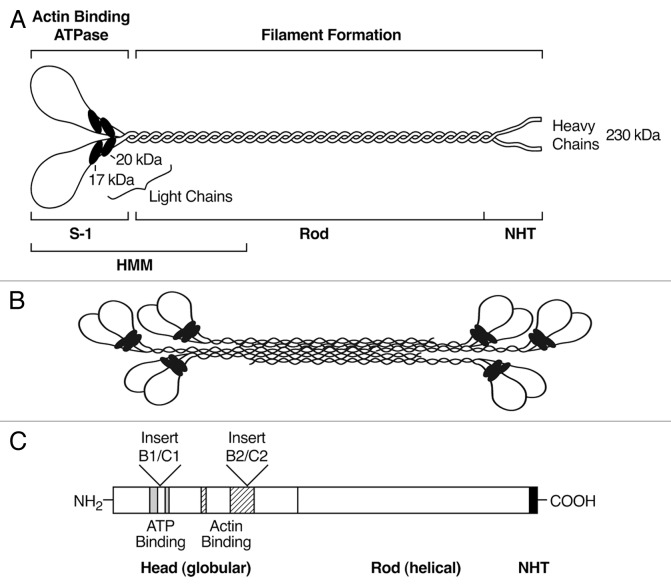
Figure 2. Schematic Diagrams of the Myosin Molecule, Filament and Insertions (not drawn to scale). (A) Diagram of a myosin molecule showing the globular head region, the α-helical coiled-coil rod and the short non-helical tail (NHT). The subfragment-1 (S-1), rod and heavy meromyosin (HMM) proteolytic domains are also indicated. (B) An example of a bipolar filament, which is formed by interaction among the rod domains. The in vitro bipolar filament contains an average of 29, 30 and 14 molecules respectively for NM II-A, II-B and II-C.5 Note the significantly smaller size of the II-C filament. (C) Exclusion or inclusion of two alternative insertions at the myosin head increases the total isoforms of NM II-B and II-C to 4 each.

An official website of the United States government
Here's how you know
Official websites use .gov
A
.gov website belongs to an official
government organization in the United States.
Secure .gov websites use HTTPS
A lock (
) or https:// means you've safely
connected to the .gov website. Share sensitive
information only on official, secure websites.
