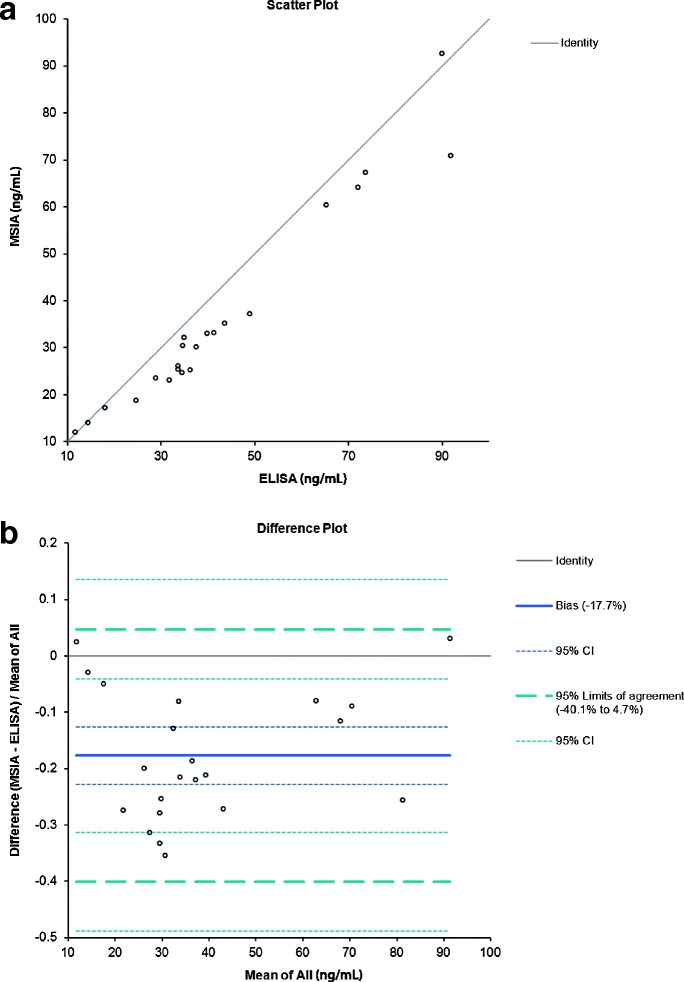
Figure 3.

Histogram of MIF concentrations determined by MSIA and ELISA for 22 healthy male serum samples. a) Scatter plot showing the direct comparison between the MIF concentrations obtained with developed MSIA and reference ELISA method; b) Altman-Bland difference plot reveals slight negative correlation (bias = −17.7%) between the MIF concentrations obtained by MSIA vs the reference ELISA method.
