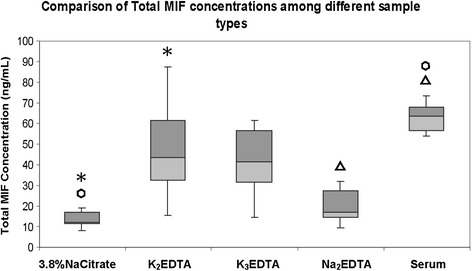
Figure 4.

Comparison of total MIF concentrations among different sample collection types. Significant differences, determined by Friedman’s test with multiple pairwise comparisons, are indicated by p-values of <0.005. Matching symbols designate significant differences.
