
Figure 2.
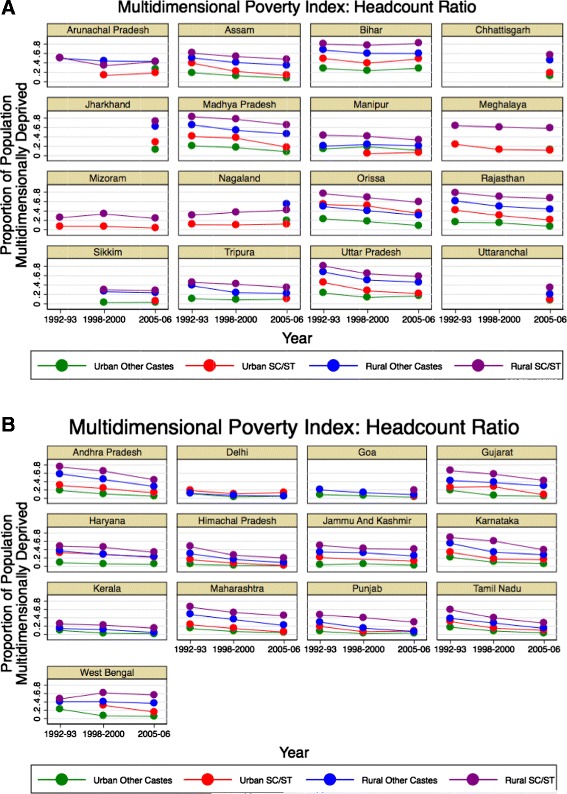
Multidimensional Poverty Index Headcount Ratio: state-level trends. NFHS-1, 2, and 3, disaggregated by urban/rural location and caste, for A) less developed states and B) more developed states. Results are not presented for subpopulations (defined by survey year, state, urbanicity, and caste) if the sample size was less than 100 households.