
Figure 3.
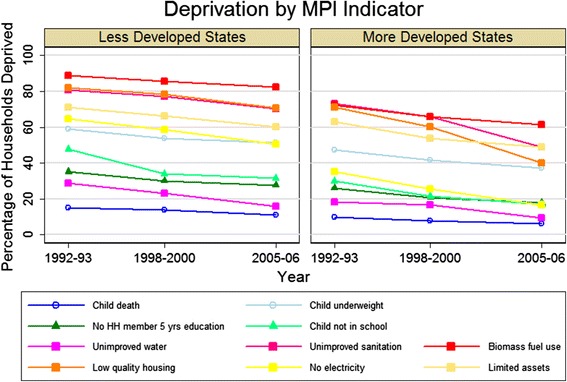
Change over time in the percentage of eligible households deprived in each of the components of the Multidimensional Poverty Index (MPI). Symbols indicate the dimension of each indicator (circle for health, triangle for education, and square for standard of living).