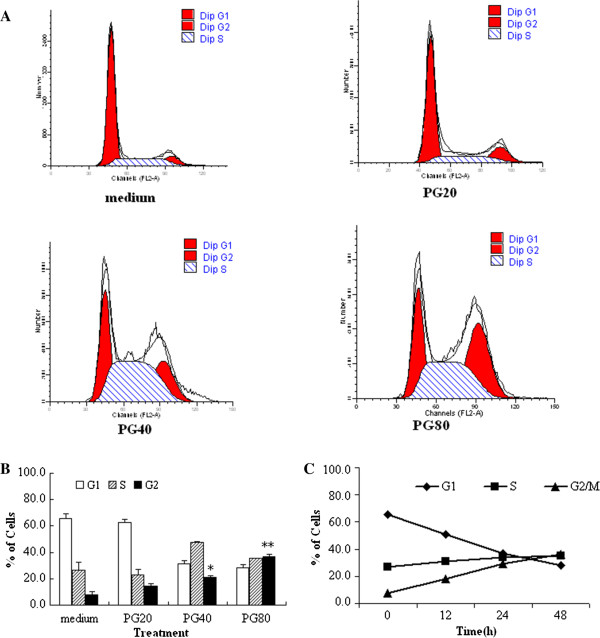
Figure 3.

Cell cycle distribution of A549 cell in vitro . In the figure, 20, 40 and 80 μg/mL of PG abbreviated as PG20, PG40 and PG80, respectively. (A and B) PG induced cell cycle arrest at G2/M phase in dose-dependent manners. Cells were treated with 20, 40 and 80 μg/mL of PG for 24 h, respectively, and then cells were harvested to determine cell cycle distribution by flow cytometry. *p < 0.05 vs. medium; **p < 0.01 vs. medium. (C) PG induced cell cycle arrest at G2/M phase in time-dependent manners. Cells were treated with 80 μg/mL of PG for 12, 24, 48 h, respectively, and then cells were harvested to determine cell cycle distribution by flow cytometry.
