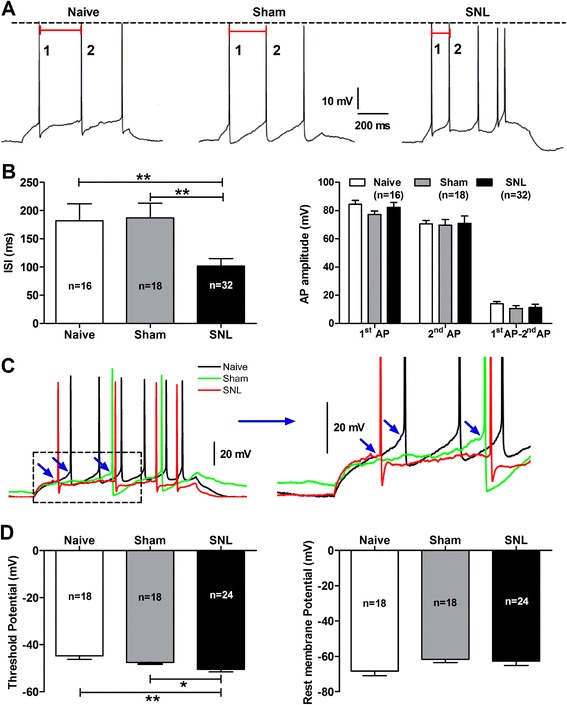
Figure 7.

Increase in intrinsic excitability of CeA neurons in SNL-induced anxiety rats. (A): representative of the 1st and the 2nd action potentials (APs) of CeA neurons evoked by a series of depolarizing step currents (duration 600 ms, increment 10 pA) from 0 pA to 110 pA. Red bar shows the time of inter-spike interval (ISI) between the 1st AP and the 2nd AP. (B): summaries of ISI and amplitude of action potentials. Note that the ISI between the 1st and the 2nd AP is dramatically increased in SNL rats compared to naïve and sham rats. **p < 0.01, one-way ANOVA, n = 16 naïve, 18 sham and 32 SNL. No changes in amplitude of the 1st and the 2nd AP and the difference between amplitude of the 1st and the 2nd AP are found in SNL rats. (C): examples represent threshold potential (TP) and rest membrane potential (RMP) of CeA neurons in naïve, sham and SNL rats, which are evoked by a series of depolarizing step currents (duration 600 ms, increment 10 pA) from 0 pA to 110 pA. Enlarged traces from the left dotted square are shown in the right panel. TP in each AP is showed by blue arrows. (D): summaries of TP (left) and RMP (right) of CeA neurons among three groups. Note that the TP of CeA neurons is more hyperpolarized in SNL rats compared to naïve and sham rats. *p < 0.05, **p < 0.01, SNL versus naïve, one-way ANOVA, n = 16 naïve, 18 sham and 32 SNL. No difference is found in RMP of CeA neurons among three groups. All recorded cells in each group are obtained from animals of naïve (4 rats); sham (4 rats) and SNL (5 rats), respectively.
