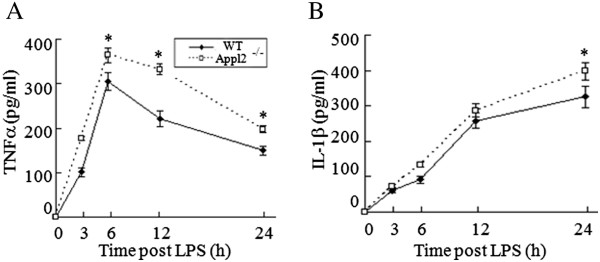
Figure 4.

Increased production of TNFα and IL-1β in Appl2 KO macrophages. (A) Kinetics of TNFα expression in the LPS-stimulated primary macrophages of the Appl2 KO and control mice. (B) Kinetics of IL-1β expression in the LPS-stimulated primary macrophages of the Appl2 KO and control mice. *p < 0.05, compared with WT mice, n = 5.
