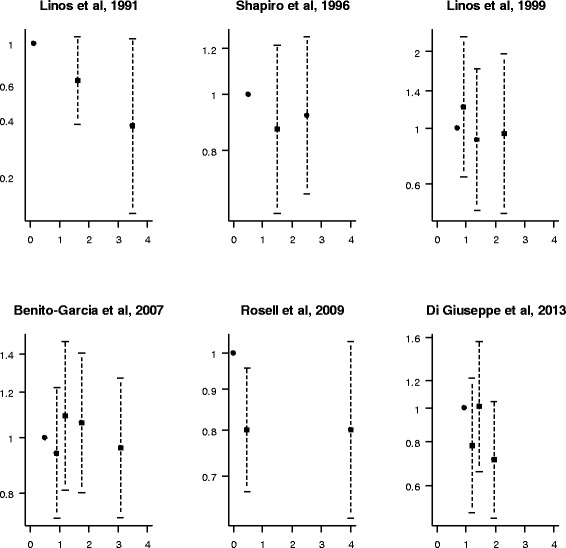
Figure 2.

Study-specific relative risk estimates for rheumatoid arthritis with increasing levels of fish consumption (servings per week). Each panel refers to a study. Black squares indicate the relative risk estimates and whiskers their 95% CI. The vertical axis is on a log scale.
