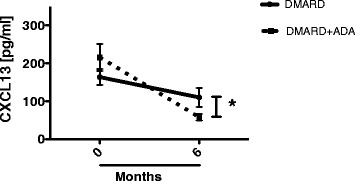
Figure 2.

Change in CXCL13 plasma levels in the two treatment groups. Lines represent the median decrease in plasma CXCL13 levels from 0 to 6 months, in the DMARD + ADA (full line) and DMARD (dotted line) groups. *Indicates a statistically significant difference between the changes in the two groups (P <0.05). ADA: adalimumab; CXCR13: C-X-C chemokine receptor type 13; DMARD: disease-modifying anti-rheumatic drug.
