
Figure 1.
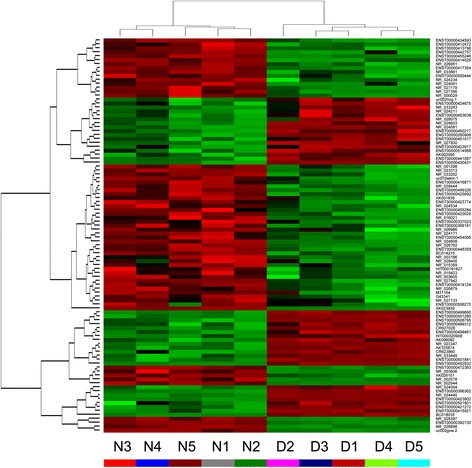
Hierarchical clustering dendrogram and heat map. Hierarchical clustering based on lncRNA expression value showed a distinguishable gene expression profiling among samples. Green strip indicates high relative expression and red strip indicates low relative expression. N1 represents normal sample 1, D1 represents degenerative sample 1, and so on.