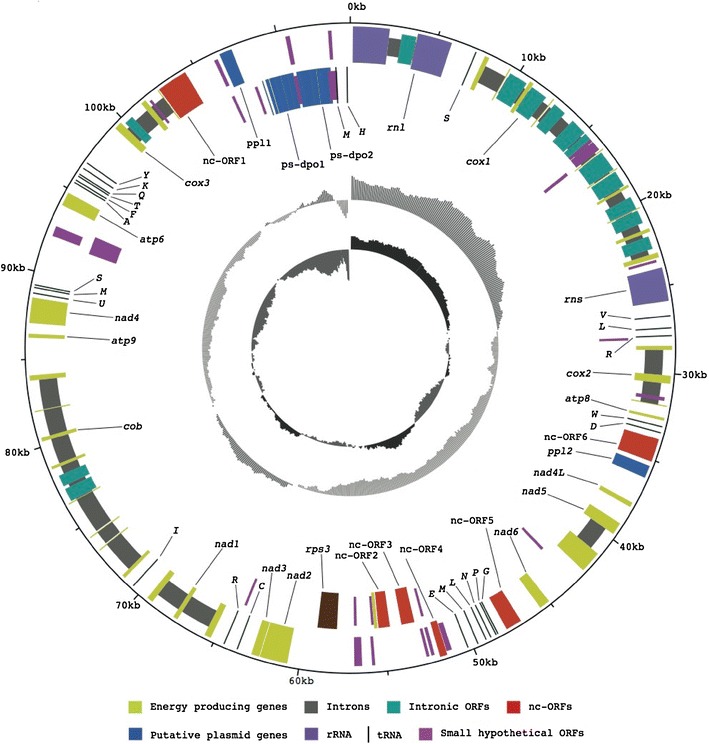
Fig. 1.

Map of the Heterobasidion irregulare mitochondrial genome. The boxes in light green are the energy producing genes, rps3 is brown, the turquoise boxes are the intronic genes, black lines represent tRNAs, the non-conserved ORFs are red-brown and the blue are the putative plasmid and pseudo-dpo genes. The different rings, from the outside and in: (i) genes in the clockwise direction. (ii) Genes in the anticlockwise direction. (iii) GC content. (iv) GC skew
