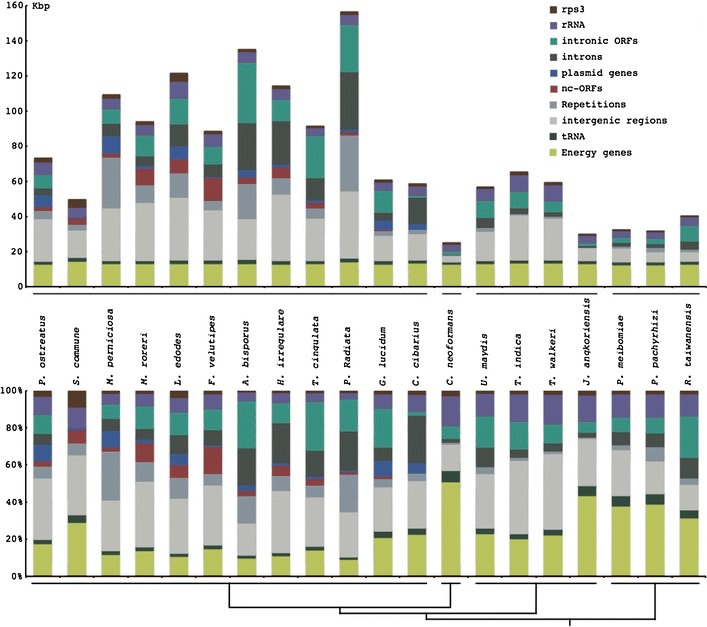
Fig. 3.

Comparison of Basidiomycete mitochondrial genome size differences, separated into different categories indicated in the diagram. The total DNA amount corresponding to each category in each genome (top panel) and the percentages of the categories for each mt genome (bottom panel) is plotted. A schematic representation of the taxonomic relationships of the included species is given
