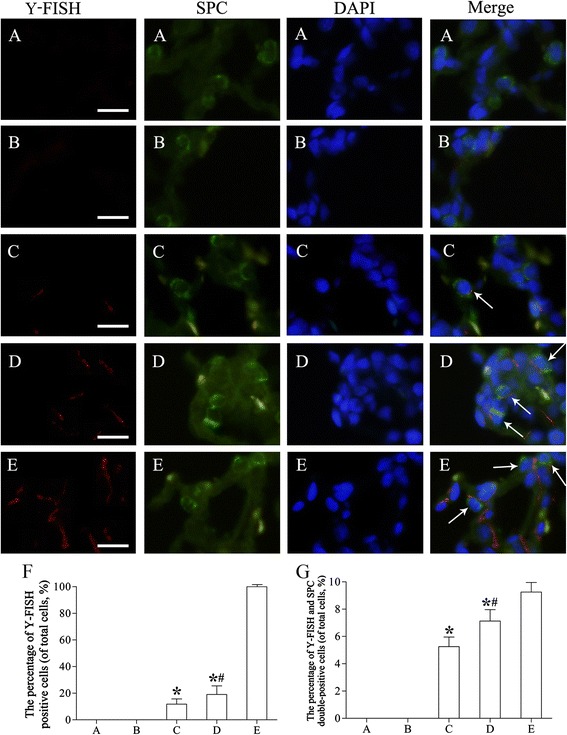
Figure 10.

Y-FISH and SPC double-immunofluorescence staining in lung tissues. (A) Control group (group I). Y-FISH staining (red) was negative. Nuclei were counterstained with DAPI (blue). (B) Emphysema group (group II). Y-FISH staining was again negative. (C) Emphysema + rAFMSC transplantation for 20 days (group III). Y-FISH staining was weakly positive and a few Y-FISH-positive cells were also positive for SPC staining (green). (D) Emphysema + rAFMSC transplantation for 40 days (group IV). The number of Y-FISH-positive cells was increased substantially, and the number of Y-FISH and SPC double-positive cells was markedly higher than that in group III. (E) Positive-control group (male rats). Y-FISH staining was strongly positive. Cells were counterstained with DAPI. (F) The percentage of Y-FISH-positive cells in each group. (G) The percentage of Y-FISH and SPC double-positive cells in each group. Values are presented as average percentages of positive cells (means ± SEM, n = 10); *P < 0.01 versus group I, # P < 0.05 versus group III. Scale bars, 40 μm.
