
Figure 3.
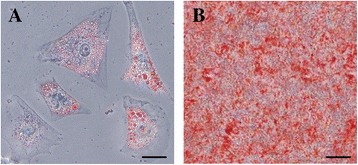
Differentiation potential of rAFMSCs. (A) Adipogenic differentiation, cells positive for Oil Red O staining. (B) Osteogenic differentiation, cells positive for alizarin red staining. Scale bars, 50 μm (A) and 200 μm (B).
Official websites use .gov
A
.gov website belongs to an official
government organization in the United States.
Secure .gov websites use HTTPS
A lock (
) or https:// means you've safely
connected to the .gov website. Share sensitive
information only on official, secure websites.
Differentiation potential of rAFMSCs. (A) Adipogenic differentiation, cells positive for Oil Red O staining. (B) Osteogenic differentiation, cells positive for alizarin red staining. Scale bars, 50 μm (A) and 200 μm (B).