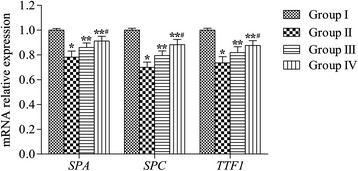
Figure 5.

SPA , SPC , and TTF1 mRNA expression in lung tissues. SPA, SPC, and TTF1 mRNA expression levels in lung tissues were determined using quantitative real-time PCR. The relative expression of SPA, SPC, and TTF1 mRNAs was calculated using the 2−ΔΔCt method. Values are presented as average expression levels of the mRNAs (means ± SEM, n = 12); *P < 0.05 versus group I, **P < 0.05 versus group II, # P < 0.05 versus group III.
