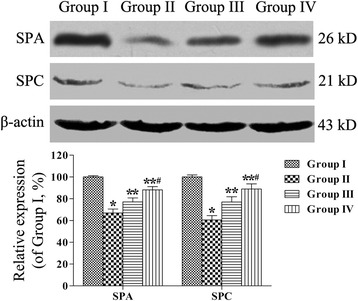
Figure 7.

Quantification of SPA and SPC protein expression by means of western blotting analysis. The loading control used was β-actin. The expression of SPA and SPC proteins was analyzed by performing densitometry and normalizing the values relative to that of β-actin. All analyses were performed in triplicate. Values are presented as means ± SEM (n = 10). *P < 0.05 versus group I, **P < 0.05 versus group II, # P < 0.05 versus group III.
