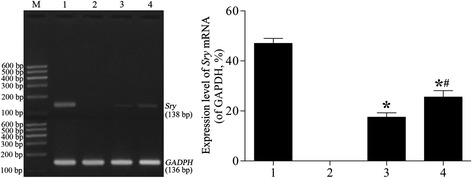
Figure 8.

Sry mRNA expression. M, DNA ladder marker; Lane 1, positive-control group (male rats); Lane 2, control group (female rats); Lane 3, emphysema + rAFMSC transplantation for 20 days (group III); Lane 4, emphysema + rAFMSC transplantation for 40 days (group IV). The expression of Sry mRNA was analyzed by normalizing the values relative to that of GAPDH. Values are presented as average expression levels of Sry mRNA (means ± SEM, n = 10); *P < 0.01 versus positive-control group, # P < 0.01 versus group III.
