
FIGURE 4.
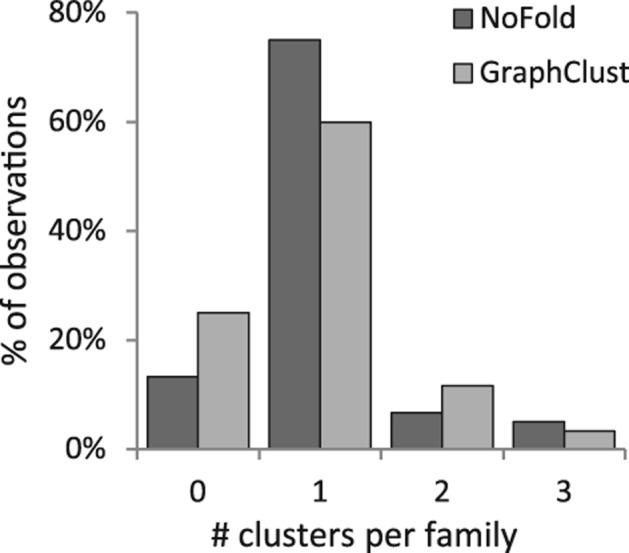
Distribution of the number of separate clusters assigned to each Rfam family for a given test. Clusters were assigned to a family only if it was the dominant family within that cluster. The observations for all 20 families across all three tests are displayed. Most families were assigned to only one cluster per test, and the maximum number of clusters per family in any test was three.