Figure 1.

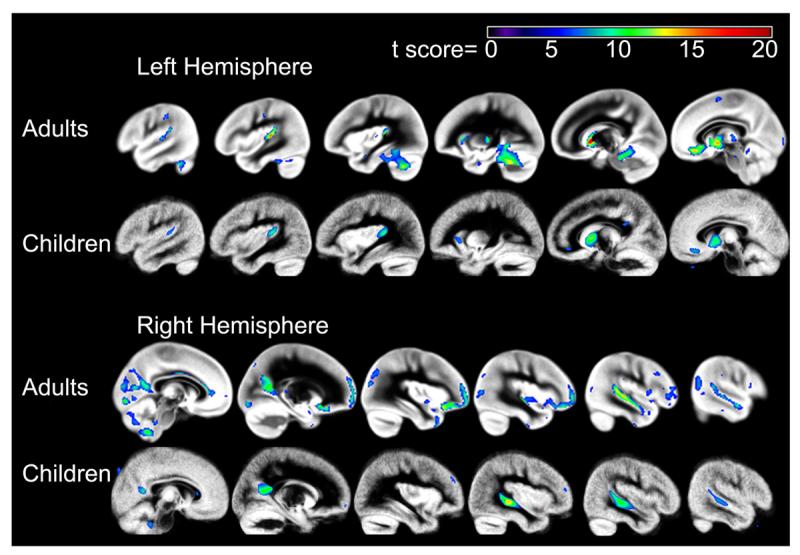
One-sample t-test gray matter asymmetry results across the brain for the adults (top) and children (bottom). The color scale represents the t score at each voxel, for a peak threshold of p<.05, family wise error corrected.

One-sample t-test gray matter asymmetry results across the brain for the adults (top) and children (bottom). The color scale represents the t score at each voxel, for a peak threshold of p<.05, family wise error corrected.