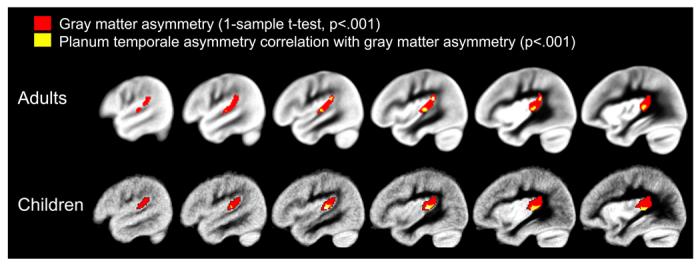
Figure 2.

The one-sample t-test pSTG results and correlation results between gray matter asymmetry and planum temporale asymmetry are presented for the adults and children. The red clusters represent areas exhibiting leftward gray matter asymmetry in the pSTG (VBM pSTG asymmetry). The yellow clusters represent areas exhibiting significant correlations between gray matter asymmetry and manually defined planum temporale asymmetry. Note that the areas showing a correlation between planum temporale asymmetry and gray matter asymmetry overlap with areas of significant gray matter asymmetry from the one-sample t-test. In addition, the overlap in results occurs at the boundaries of the planum temporale, and in a region corresponding to Heschl’s sulcus in particular. The maps are thresholded at p<.001, uncorrected for multiple comparisons.
