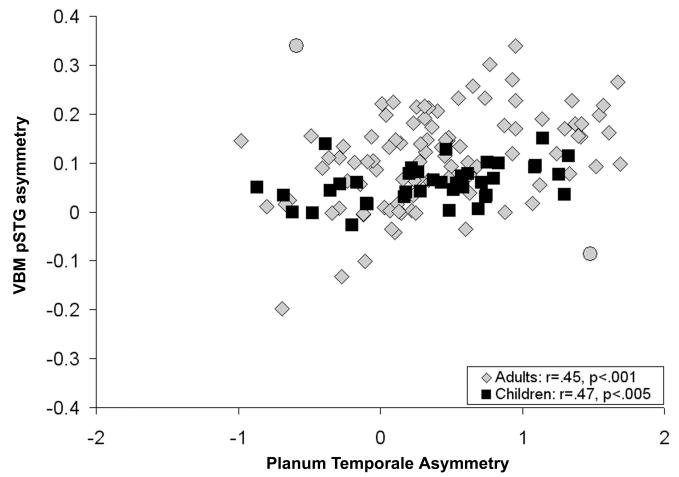
Figure 3.
Scatter-plot of the association between manually defined planum temporale asymmetry and the VBM pSTG asymmetry measure (Figure 2) in the samples of adults (gray diamonds) and children (black squares). Two outliers (gray circles) in the adult sample were not included in the correlation between the two anatomical measures.

