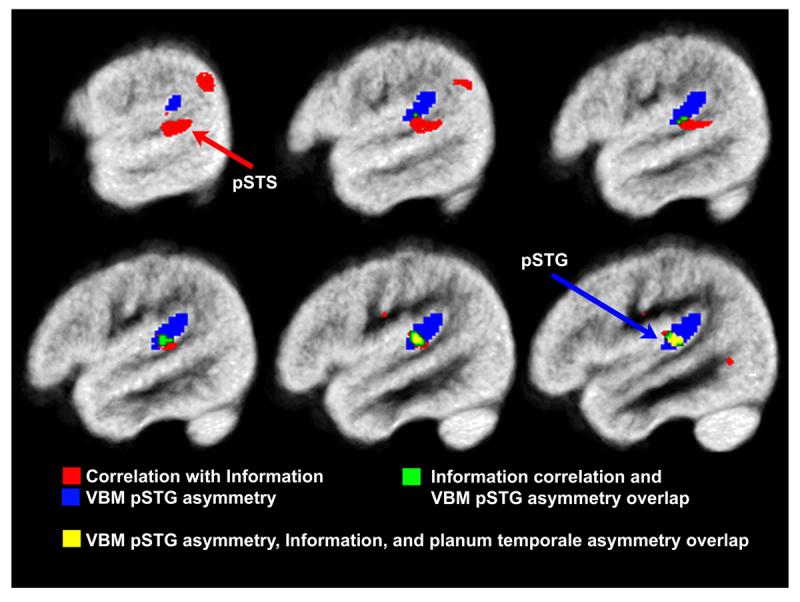
Figure 4.

pSTG and pSTS gray matter asymmetry was significantly correlated with WISC Information performance. The red clusters represent regions correlated with Information performance, overlaid with the blue cluster showing regions of significant pSTG gray matter asymmetry across the group (VBM pSTG asymmetry), the green clusters represent regions that exhibited significant leftward VBM pSTG asymmetry and were correlated with Information performance, and the yellow cluster represents regions that exhibited significant leftward VBM pSTG asymmetry, were correlated with Information performance, and were correlated with planum temporale asymmetry. Note the overlap between the three clusters, which is consistent with the regression results demonstrating redundant predictive power of the planum temporale asymmetry and pSTG gray matter asymmetry variables. The maps are thresholded at p<.001, uncorrected for multiple comparisons. The most lateral pSTS region (red arrow) was also significantly correlated with Information performance after controlling for family wise error p<.05.
