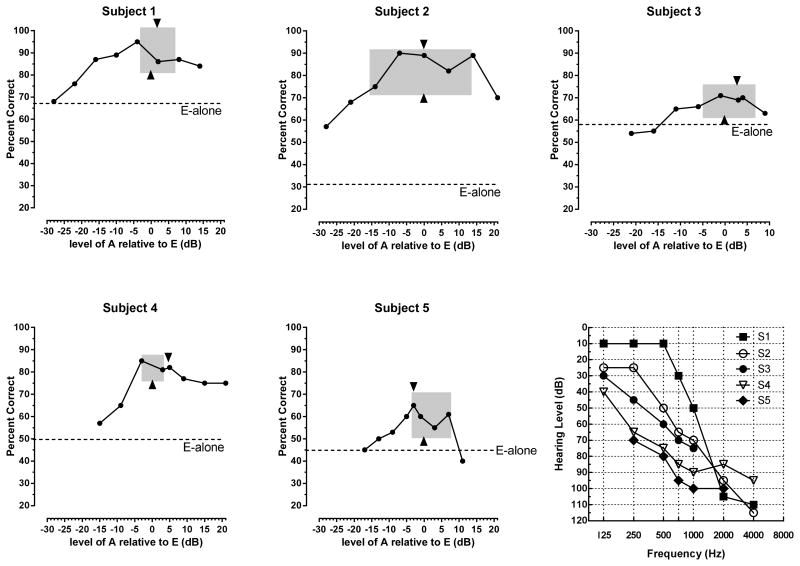
Figure 1.
Percent correct sentence understanding as a function of the level of the acoustic signal. E = CI stimulation. A = low-frequency acoustic stimulation. Left edge of grey box = acoustic stimulation level just softer than the CI level. Right edge of grey box = acoustic stimulation level just louder than the CI level. Arrow at bottom of box = balance point for acoustic and electric stimulation. Arrow at top of box = MCL for acoustic stimulation. Bottom right figure shows audiograms of the acoustically stimulated ear.

