
Figure 2.
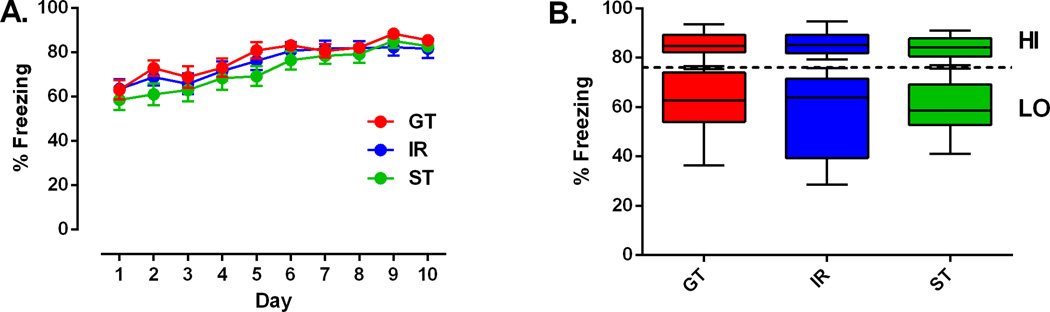
Acquisition of a conditioned freezing response. (A) Percentage of freezing (mean ± SEM) for sign-trackers (ST, n = 28), intermediate responders (IR, n = 37), and goal-trackers (GT, n = 29) over 10 days. For each day, freezing during the 30-sec tone presentations was averaged across the entire session. (B) Rats were designated based on a median split of average freezing as high-conditioning (ST, n = 14; IR, n = 20; GT, n = 13) and low-conditioning (ST, n = 14; IR, n =17; GT, n = 16). Data are depicted as box plots with maximum and minimum values (whiskers) for each group. The dotted line is the median for the overall sample. Rats received 10 trials per day for 10 days, each trial consisting of a 30-sec tone presentation immediately followed by a foot shock.