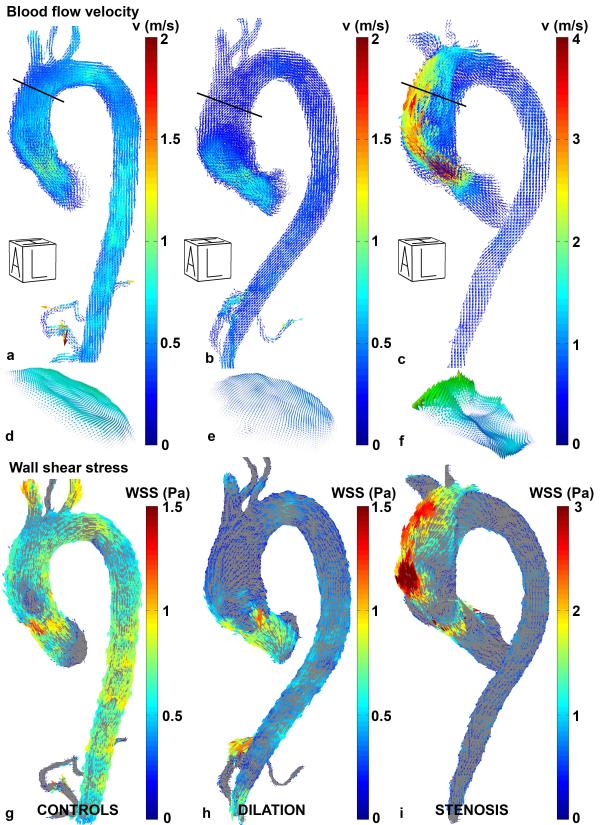
Figure 6.
Left-anterior oblique views of velocity vectors in a typical control aorta (a), dilated aorta (b) and aorta with severe valve stenosis (c). The black lines indicate the location of the planes for which the velocity profiles are shown in (d), (e) and (f). Note that for visualization purposes, the velocity color bar for the aorta with valve stenosis is two times higher than for the other two aortas. Figures (g), (h) and (i) show the 3D WSS pattern in the left-anterior oblique view for the control, dilated and aorta with valve stenosis. Also note that for visualization purposes, the WSS color bar for the aorta with valve stenosis is two times higher than for the other two aortas. A = Anterior, L = Left, H = Head.

