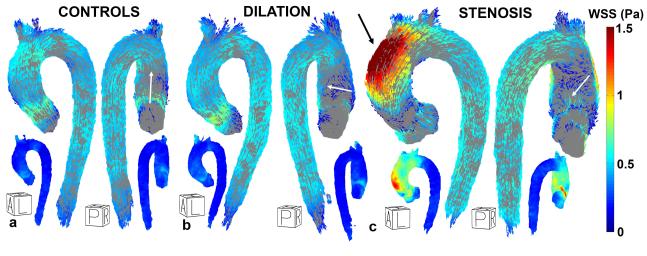
Figure 7.
Left-anterior oblique and posterior view of the cohort-specific 3D WSS map for healthy controls (a), dilated aortas (b) and aortas with valve stenosis (c). The small inserts show the SD maps. The average regional WSS direction on the inner curvature of the AAo is shown by white arrows. The black arrow in (c) indicates elevated WSS at the outer curvature of the AAo. A = Anterior, P = Posterior, L = Left, R = Right, H = Head.

