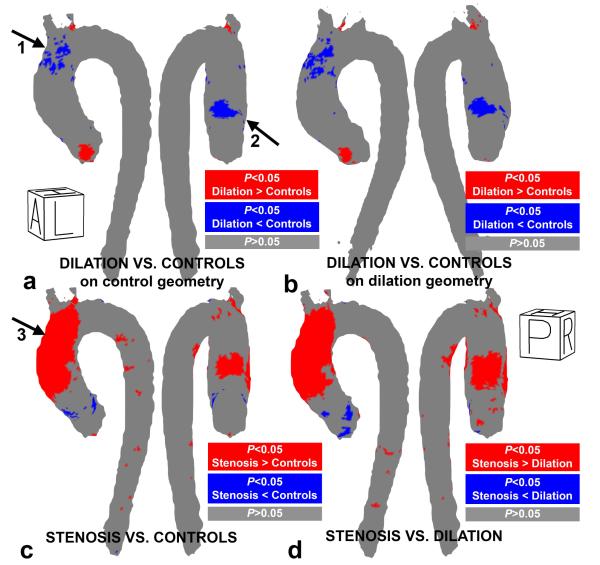
Figure 8.
P-value maps of regional WSS differences in (a) the patients with aortic dilation vs. controls on the control geometry, (b) the patients with aortic dilation vs. controls on the dilation geometry (c) patients with aortic stenosis vs. controls and (d) patients with aortic stenosis vs. aortic dilation. Significant differences (Wilcoxon rank sum test, p<0.05) are color coded in blue and red.

